Node Metrics
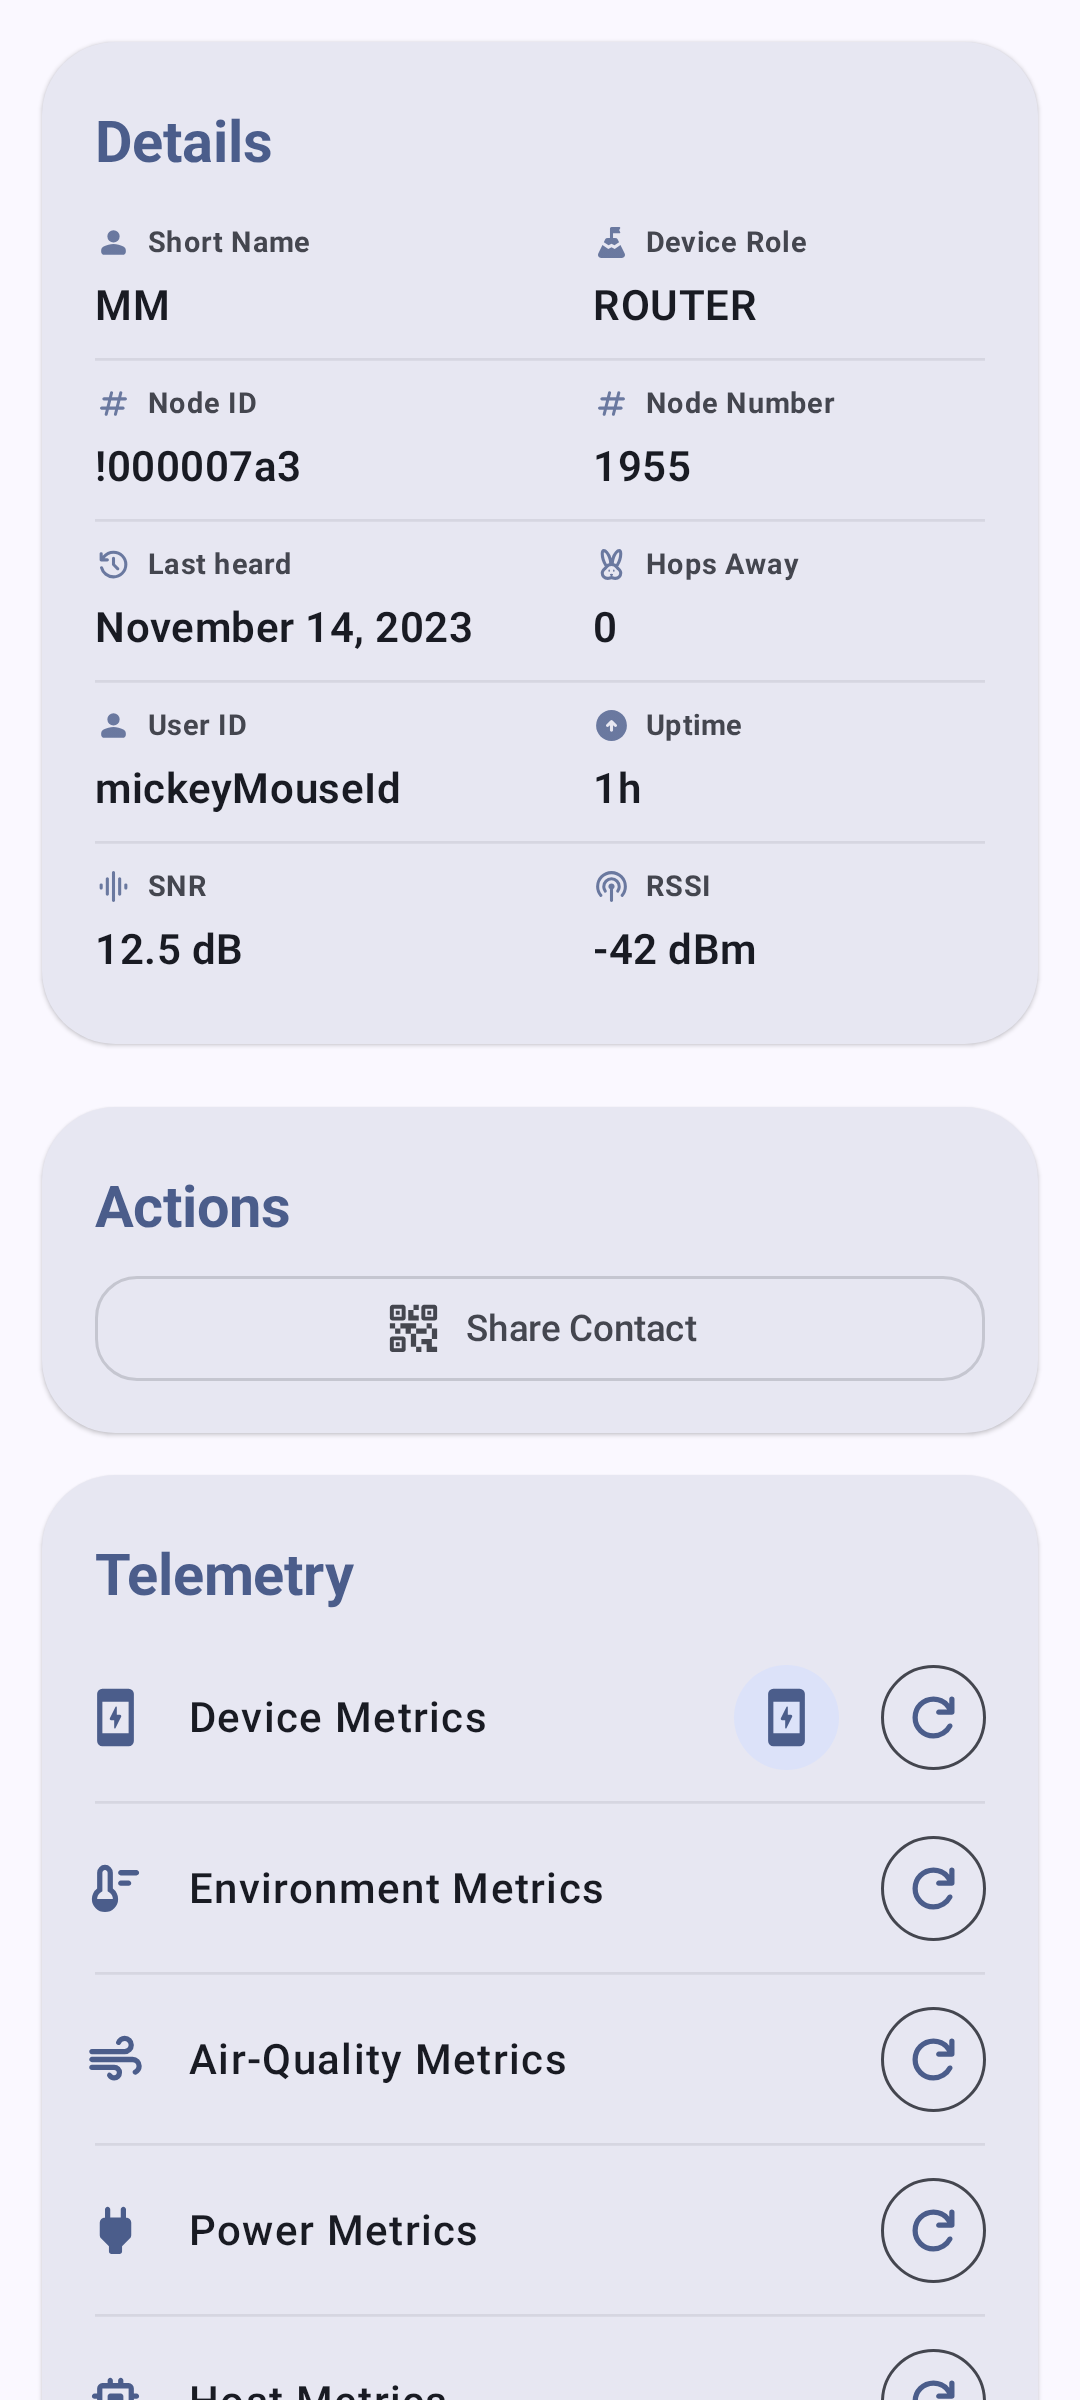
The node detail screen provides comprehensive telemetry and metrics for each node on your mesh.
Gerätedaten
Basic operating information reported by each node:
| Metrisch | Beschreibung |
|---|---|
| Batterie Ladung | Current battery percentage |
| Spannung | Battery voltage reading |
| Kanalbelegung | Percentage of airtime consumed |
| Airtime | Transmission time used by this node |
| Laufzeit | Time since last reboot |
Device metrics are displayed as individual cards with trend sparklines showing battery level, voltage, channel utilization, airtime, and uptime over time.
💡 Tip: Tap any metric card to expand it into a full chart with historical data points. Pinch to zoom the time axis.
Umweltdaten
Environmental sensor data (requires compatible hardware):
| Metrisch | Sensor Examples |
|---|---|
| Temperatur | BME280, BME680, SHT31 |
| Luftfeuchtigkeit | BME280, BME680, SHT31 |
| Luftdruck | BME280, BMP280 |
| Gaswiderstand | BME680 |
| IAQ (Air Quality) | BME680 |
Environment metrics are charted over time for easy trend analysis — temperature, humidity, and pressure each get their own line chart with the measurement unit displayed on the Y axis.
💡 Tip: Environment metrics require a sensor connected to the remote node. Not all nodes report environmental data. See Telemetry & Sensors for a full list of supported sensors.
Signaldaten
Radio signal quality information:
| Metrisch | Beschreibung |
|---|---|
| SNR | Signal-to-Noise Ratio (higher is better) |
| RSSI | Received Signal Strength Indicator (closer to 0 is better) |
| Sprungweite | Number of mesh hops for last message |
Signal Quality Reference
| SNR Range | Quality |
|---|---|
| > 10 dB | Excellent |
| 0 to 10 dB | Gut |
| -10 to 0 dB | Ordentliche Signalstärke |
| < -10 dB | Poor |
Energiedaten
Power management telemetry (requires INA sensor or compatible hardware):
| Metrisch | Beschreibung |
|---|---|
| Bus Voltage | Supply voltage |
| Stromstärke | Power draw in milliamps |
| Leistung | Calculated wattage |
Traceroute
Traceroute shows the path a message takes through the mesh:
- From the node detail screen, tap Traceroute.
- The app sends a traceroute request to the target node.
- Results show each hop with SNR/RSSI values.
Reading Traceroute Results
You → Node A (SNR: 8.5) → Node B (SNR: 5.2) → Target
Each hop represents a relay node that forwarded the message.
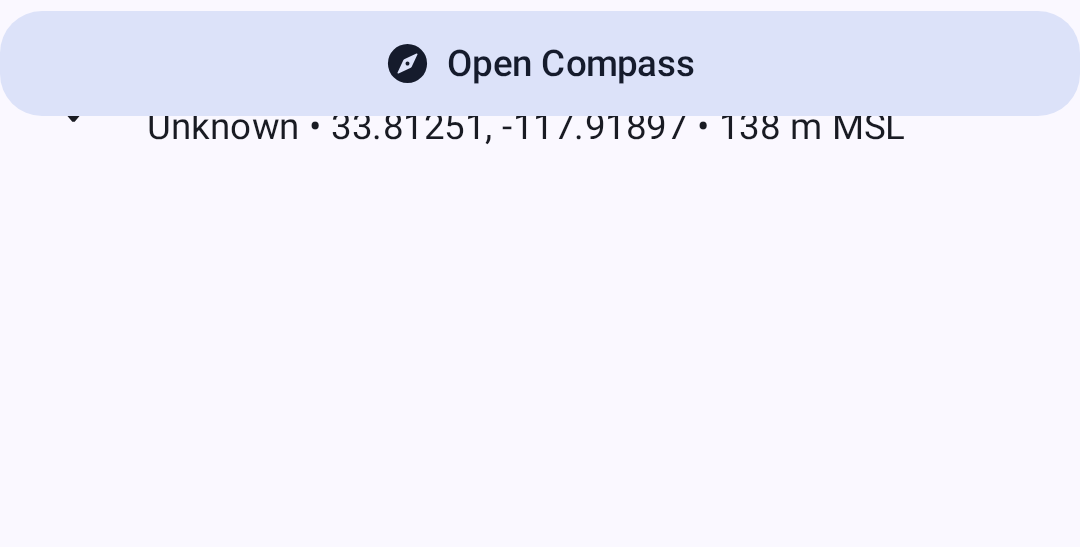
Standortprotokoll
Historical position data for nodes that share their location:
- GPS coordinates
- Höhe
- Speed (if moving)
- Timestamp for each position report
Nachbarinformation
Shows which nodes a given node can directly hear, useful for understanding mesh topology.
Viewing Metrics
- Navigate to Nodes.
- Tap the node you want to inspect.
- Select the metric category from the detail tabs.
The position tab shows location data for nodes that share GPS:
⚠️ Note: Metrics are only available when they have been reported by the remote node. Metrics update at intervals configured on each node’s telemetry settings.
Related Topics
- Nodes — node list, filtering, and sorting
- Telemetry & Sensors — supported sensors and configuration
- Signal Meter — how signal quality is calculated from SNR and RSSI
- Discovery — traceroute details and neighbor info
- Units & Locale — temperature, distance, and speed display formats