Telemetry & Sensors
Meshtastic nodes can collect and share sensor data across the mesh network.
Overview
Telemetry allows nodes equipped with sensors to broadcast environmental, power, and device health information. This data is visible on the node detail screen and can be logged over time.
Device Telemetry
All Meshtastic nodes report basic device telemetry:
| Metric | Descrição | Typical Range |
|---|---|---|
| Battery Level | Charge percentage | 0–100% |
| Voltagem | Battery voltage | 3.0–4.2V (LiPo) |
| Utilização do Canal | % of airtime used locally | 0–100% |
| Air Utilization TX | % of airtime used by this node | 0–100% |
| Uptime | Seconds since last boot | Varies |
Environment Sensors
Supported environmental sensors:
Temperature & Humidity
| Sensor | Temperatura | Umidade | Pressão | Notes |
|---|---|---|---|---|
| BME280 | ✓ | ✓ | ✓ | Recommended all-in-one |
| BME680 | ✓ | ✓ | ✓ | Adds gas resistance/IAQ |
| SHT31 | ✓ | ✓ | — | High accuracy |
| MCP9808 | ✓ | — | — | Precision temperature |
| LPS22 | — | — | ✓ | Pressure only |
Air Quality
| Sensor | Metric | Notes |
|---|---|---|
| BME680 | Gas Resistance / IAQ | Volatile organic compounds |
| PMSA003I | PM1.0, PM2.5, PM10 | Particulate matter |
| SEN55 | PM, NOx, VOC, Temp, Humidity | Multi-sensor |
Light & UV
| Sensor | Metric |
|---|---|
| OPT3001 | Ambient light (lux) |
| VEML7700 | Ambient light (lux) |
| LTR390 | UV index |
Power Metrics
Nodes with INA-series power sensors can report:
| Metric | Descrição |
|---|---|
| Bus Voltage | Supply rail voltage |
| Atual | Power consumption (mA) |
| Energia | Calculated power (mW) |
Useful for monitoring solar charging or battery health on remote nodes.
Configuring Telemetry
- Navigate to Settings → Module Config → Telemetry.
- Set reporting intervals:
- Device Metrics Interval — how often to broadcast device metrics
- Environment Metrics Interval — how often to broadcast sensor data
- Enable specific sensor types as needed.
Recommended Intervals
| Use Case | Device (s) | Environment (s) |
|---|---|---|
| Urban mesh (many nodes) | 3600 | 3600 |
| Rural mesh (few nodes) | 900 | 900 |
| Weather station | 900 | 300 |
| Battery conservation | 7200 | 7200 |
⚠️ Note: Shorter intervals increase airtime usage and battery drain across the mesh.
Air Quality Metrics
Nodes with particulate matter or CO₂ sensors report air quality data:
| Metric | Unit | Descrição |
|---|---|---|
| PM1.0 | µg/m³ | Ultrafine particulate matter |
| PM2.5 | µg/m³ | Fine particulate matter |
| PM10 | µg/m³ | Coarse particulate matter |
| CO₂ | ppm | Carbon dioxide concentration |
CO₂ sensors such as the SCD4x also report their own temperature and humidity, which appear alongside the readings above. From PM2.5 history the app additionally derives an EPA NowCast AQI value.
The CO₂ reading is color-coded by severity (Good → Stuffy → Poor → Unsafe → Evacuate). See Node Metrics — Air Quality for the exact ppm bands, colors, and AQI detail.
Air quality data can be viewed as info cards on the node detail screen, charted over time, and exported to CSV.
Viewing Telemetry
- Navigate to Nodes and select a node.
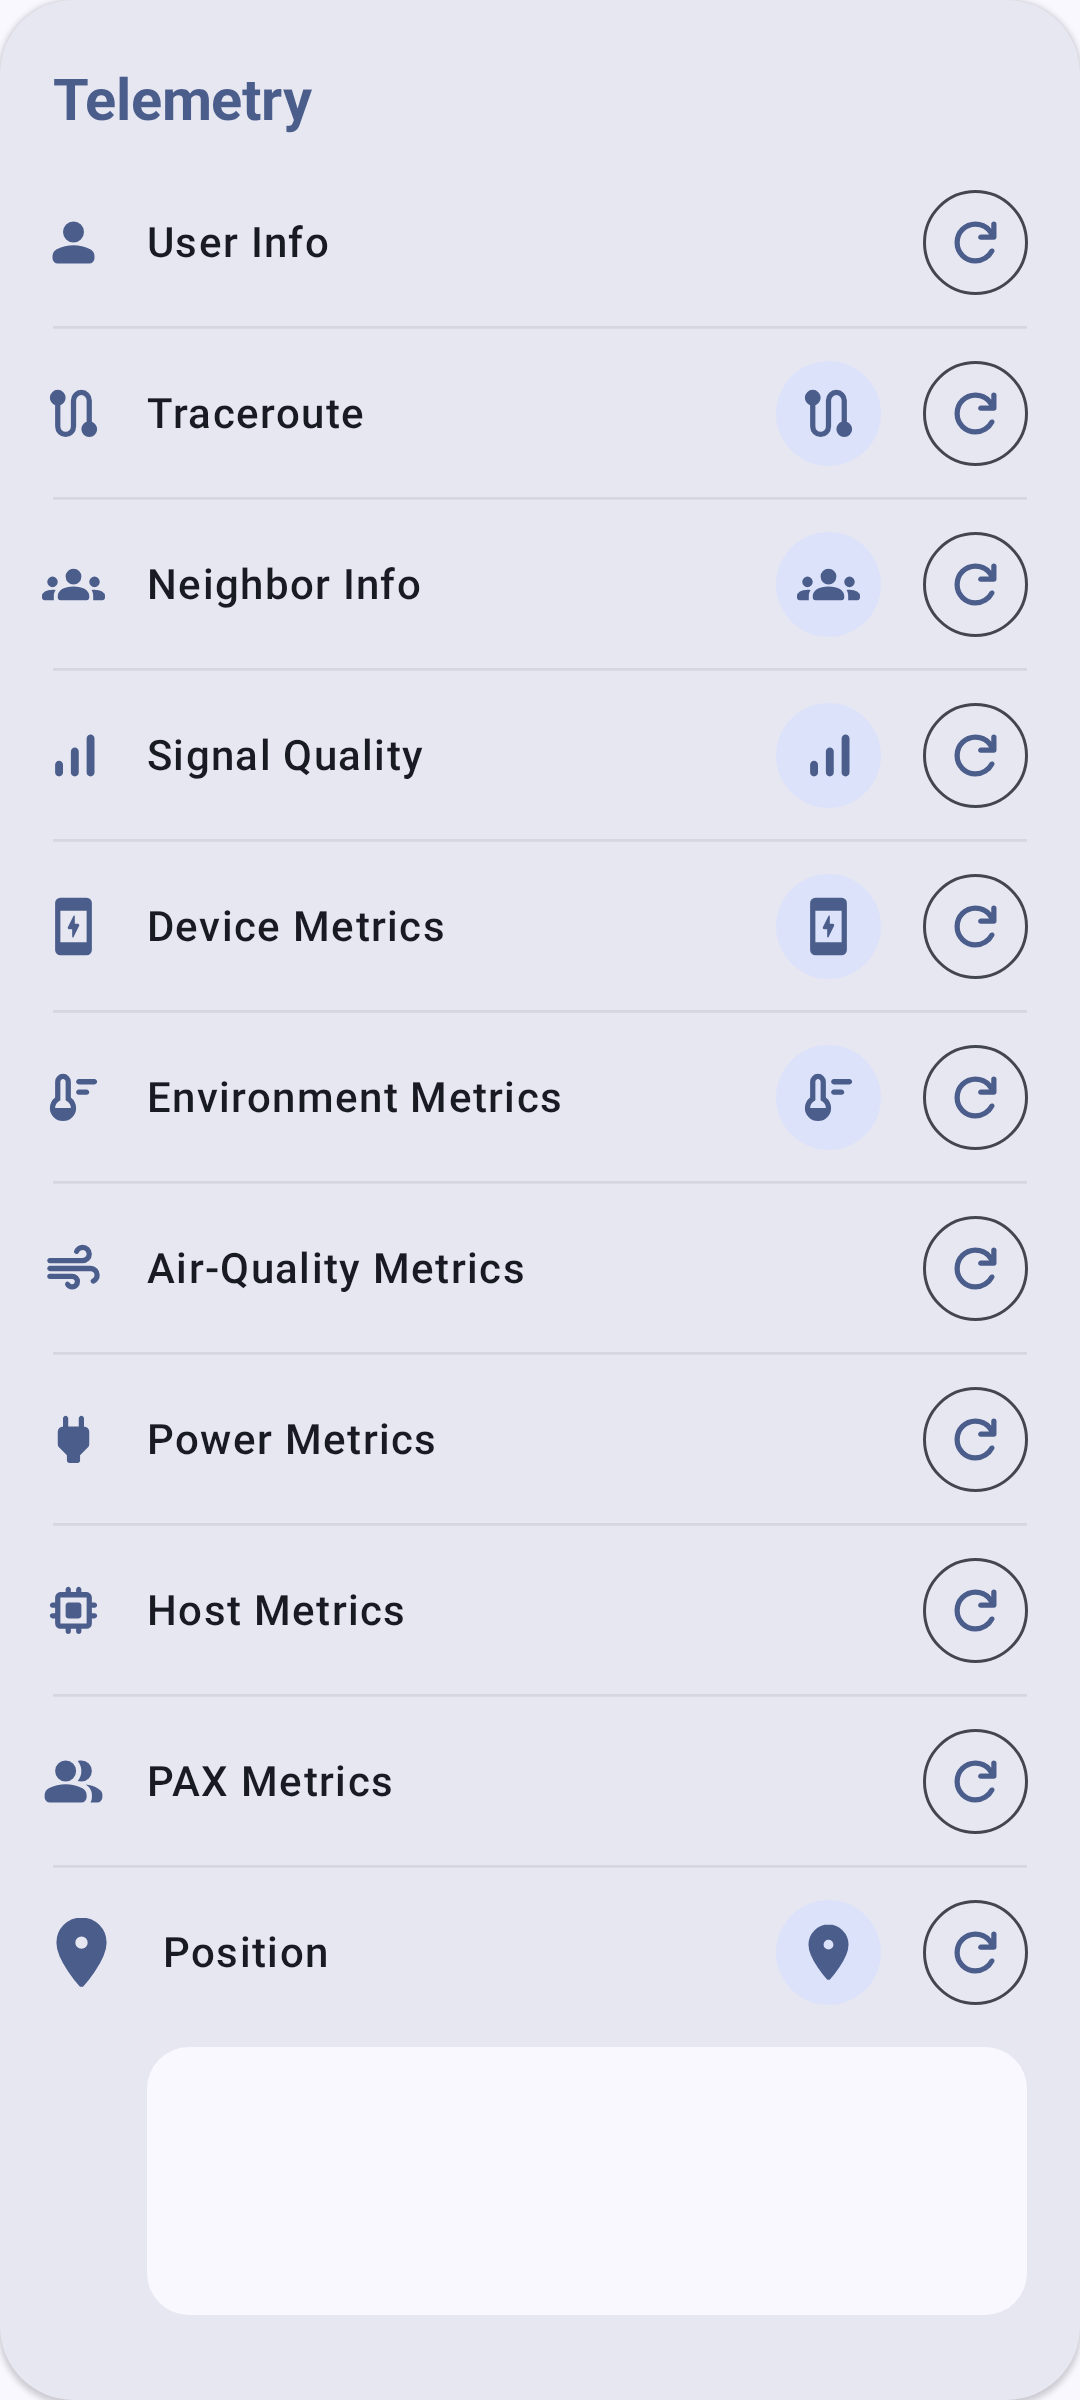
- Telemetry sections show on the detail screen:
- Device Metrics (always available)
- Environment Metrics (if sensors present)
- Power Metrics (if INA sensor present)
- Air Quality Metrics (if PM/CO₂ sensor present)
- Historical graphs show trends over time.
Troubleshooting
- No environment data showing? The remote node needs a physical sensor connected (e.g., BME280 on I2C). Device telemetry (battery, uptime) is always available, but environment metrics require hardware.
- Stale readings? Check the reporting interval — very long intervals (7200s+) mean data updates infrequently. Also verify the remote node is still online.
- Sensor conflict on I2C bus? Some sensors share I2C addresses. If you have multiple sensors on the same bus, check for address collisions in the radio’s serial debug output.
Related Topics
- Node Metrics — view telemetry data on the node detail screen
- Settings — Modules & Admin — telemetry module configuration
- Units & Locale — temperature and pressure display units